

LLMs · Google
RecurrentGemma 9B IT
- Parameters
- 9.6B
- Architecture
- Dense
- Max context
- 8K tokens
- License
- gemma
- Released
- 2024-06
How to run it
No mobile app in the App Store runs RecurrentGemma 9B IT right now: mobile apps need a GGUF version, and none is published. Mobile apps · models that run on mobile devices.
No mobile app in the Play Store runs RecurrentGemma 9B IT right now: mobile apps need a GGUF version, and none is published. Mobile apps · models that run on mobile devices.
On a mobile device
RecurrentGemma 9B IT is too big for a device like yours: it needs more memory than the device has. Models that run on mobile devices.
Original weights · Hugging Face
Full-precision files from Google, for fine-tuning, vLLM, Transformers.
huggingface.co/google/recurrentgemma-9b-it (opens in a new tab)
Memory needed
Weights plus KV cache and runtime overhead. Leave a little extra free for the operating system and other apps. Try another context length.
| Quantization | Quality | Weights | Total at 8K context | Download |
|---|---|---|---|---|
Q2_K |
Low | 3.9 GB | 4.6 GB | All files (opens in a new tab) |
Q3_K_M |
Low | 4.7 GB | 5.4 GB | All files (opens in a new tab) |
Q4_K_M |
Good | 5.9 GB | 6.6 GB | All files (opens in a new tab) |
Q5_K_M |
High | 6.8 GB | 7.5 GB | All files (opens in a new tab) |
Q6_K |
High | 7.9 GB | 8.6 GB | All files (opens in a new tab) |
Q8_0 |
Very high | 10.2 GB | 10.9 GB | All files (opens in a new tab) |
F16 |
Full | 19.3 GB | 20.0 GB | Original weights (opens in a new tab) |
Best hardware for RecurrentGemma 9B IT
The least expensive GPU in our catalog that runs it without offloading is the Intel Arc A380 (launch price $139) at Q2_K.
| Quality | Hardware | Quant | Memory | Speed | Runs |
|---|---|---|---|---|---|
| 34Basic quality (D) · 34 of 100: how capable the model is at Q8_0, whatever it runs on. Match score 70/100 (quality, fit, speed and memory use) sets the ranking. | 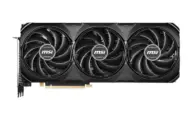 NVIDIA GeForce RTX 4070 Ti SUPER |
Q8_0 | 11.7 GB / 16.0 GB | 43.6 tok/s | Runs great |
| 34Basic quality (D) · 34 of 100: how capable the model is at Q8_0, whatever it runs on. Match score 70/100 (quality, fit, speed and memory use) sets the ranking. | 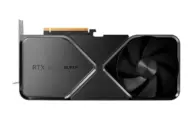 NVIDIA GeForce RTX 4080 SUPER |
Q8_0 | 11.7 GB / 16.0 GB | 47.8 tok/s | Runs great |
| 34Basic quality (D) · 34 of 100: how capable the model is at Q8_0, whatever it runs on. Match score 70/100 (quality, fit, speed and memory use) sets the ranking. | 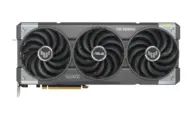 NVIDIA GeForce RTX 5070 Ti |
Q8_0 | 11.7 GB / 16.0 GB | 58.1 tok/s | Runs great |
| 34Basic quality (D) · 34 of 100: how capable the model is at Q8_0, whatever it runs on. Match score 70/100 (quality, fit, speed and memory use) sets the ranking. | 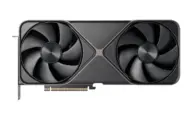 NVIDIA GeForce RTX 5080 |
Q8_0 | 11.7 GB / 16.0 GB | 62.3 tok/s | Runs great |
| 34Basic quality (D) · 34 of 100: how capable the model is at F16, whatever it runs on. Match score 70/100 (quality, fit, speed and memory use) sets the ranking. | 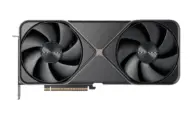 NVIDIA GeForce RTX 5090 |
F16 | 21.6 GB / 32.0 GB | 53.6 tok/s | Runs great |
| 33Basic quality (D) · 33 of 100: how capable the model is at Q6_K, whatever it runs on. Match score 70/100 (quality, fit, speed and memory use) sets the ranking. | 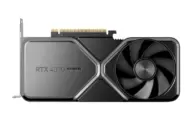 NVIDIA GeForce RTX 4070 SUPER |
Q6_K | 9.2 GB / 12.0 GB | 44.6 tok/s | Runs great |
| 33Basic quality (D) · 33 of 100: how capable the model is at Q6_K, whatever it runs on. Match score 68/100 (quality, fit, speed and memory use) sets the ranking. | 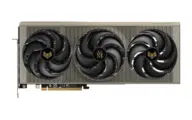 AMD Radeon RX 9070 XT |
Q6_K | 9.4 GB / 16.0 GB | 48.7 tok/s | Runs great |
| 33Basic quality (D) · 33 of 100: how capable the model is at Q6_K, whatever it runs on. Match score 68/100 (quality, fit, speed and memory use) sets the ranking. | 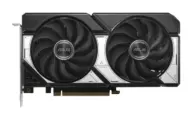 NVIDIA GeForce RTX 5060 Ti 16GB |
Q6_K | 9.4 GB / 16.0 GB | 39.6 tok/s | Runs great |
| 32Basic quality (D) · 32 of 100: how capable the model is at Q4_K_M, whatever it runs on. Match score 68/100 (quality, fit, speed and memory use) sets the ranking. | 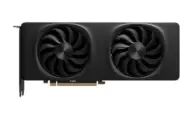 Intel Arc B580 |
Q4_K_M | 7.2 GB / 12.0 GB | 44.4 tok/s | Runs great |
| 32Basic quality (D) · 32 of 100: how capable the model is at Q4_K_M, whatever it runs on. Match score 68/100 (quality, fit, speed and memory use) sets the ranking. | 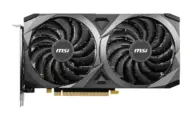 NVIDIA GeForce RTX 3060 12GB |
Q4_K_M | 7.2 GB / 12.0 GB | 45.9 tok/s | Runs great |
Estimates come from published hardware specs and our open formulas, not from running the model on your machine. Real speed varies with runtime, drivers and settings. Numbers marked “Measured” come from a linked benchmark.