

Products · TerraMaster · NAS
TerraMaster F5-221
- Processor
- Intel Celeron J3455 / N3450 (Apollo Lake)
- Memory (RAM)
- 6 GB
Product page (opens in a new tab)Discontinued Full AI report
Specifications
| Maker | TerraMaster |
|---|---|
| Type | NAS |
| Processor | Intel Celeron J3455 / N3450 (Apollo Lake) NAS (6 GB) · upgraded to the maker's maximum |
| Memory (RAM) | 6.0 GB |
| Usable for AI models | 3.5 GB |
| Memory bandwidth | 15 GB/s |
| FP16 compute | 0.0 TFLOPS |
| Runs models on | CPU cores |
| Drive bays | 5x SATA |
| NAS system | TOS 4.x |
| Containers (Docker) | Yes |
| Virtual machines | Yes |
| Memory upgrade | DDR3 SODIMM (non-ECC) · 1 slot · up to 6.0 GB per the maker · non-ECC |
| Availability | Discontinued (sold used or refurbished) |
| Notes | Intel Celeron J3355. CPU only: 2016 Apollo Lake Celeron without AVX and at most 6 GB of DDR3 memory. Only the smallest quantised models (about 1B) could load, and very slowly. Treat as not practical for chat models. |
| Product page | www.terra-master.com (opens in a new tab)Discontinued |
Running AI on the TerraMaster F5-221
It can, with limits: expect small models only, at modest speed. Models run on its CPU cores, and this configuration leaves about 3.5 GB for them after the NAS system and its storage services. The grades below assume the NAS isn’t busy with backups or media work at the same time.
Apps you can install to run models
| App | How it installs |
|---|---|
| Ollama | In a container (Docker) |
| Open WebUI | In a container (Docker) |
Best LLMs for the TerraMaster F5-221
| Quality | Model | Quant | Memory | Speed | Runs |
|---|---|---|---|---|---|
| 57Good quality (B) · 57 of 100: how capable the model is at Q3_K_M, whatever it runs on. Match score 67/100 (quality, fit, speed and memory use) sets the ranking. | Nemotron Labs Dory 1.0 4B | Q3_K_M | 3.3 GB | 1.7 tok/s | Very slowtight fit |
| 55Good quality (B) · 55 of 100: how capable the model is at Q3_K_M, whatever it runs on. Match score 66/100 (quality, fit, speed and memory use) sets the ranking. | Spark-X2.6 4B | Q3_K_M | 3.2 GB | 1.6 tok/s | Very slowtight fit |
| 52Fair quality (C) · 52 of 100: how capable the model is at Q3_K_M, whatever it runs on. Match score 65/100 (quality, fit, speed and memory use) sets the ranking. | Qwen3.5 4B | Q3_K_M | 3.4 GB | 1.4 tok/s | Very slowtight fit |
| 51Fair quality (C) · 51 of 100: how capable the model is at Q3_K_M, whatever it runs on. Match score 65/100 (quality, fit, speed and memory use) sets the ranking. | TMax 4B | Q3_K_M | 3.2 GB | 1.6 tok/s | Very slowtight fit |
| 50Fair quality (C) · 50 of 100: how capable the model is at Q3_K_M, whatever it runs on. Match score 64/100 (quality, fit, speed and memory use) sets the ranking. | Agents-A1 4B | Q3_K_M | 3.4 GB | 1.4 tok/s | Very slowtight fit |
| 48Fair quality (C) · 48 of 100: how capable the model is at Q3_K_M, whatever it runs on. Match score 63/100 (quality, fit, speed and memory use) sets the ranking. | Fara 1.5 4B | Q3_K_M | 3.4 GB | 1.4 tok/s | Very slowtight fit |
| 36Basic quality (D) · 36 of 100: how capable the model is at Q3_K_M, whatever it runs on. Match score 63/100 (quality, fit, speed and memory use) sets the ranking. | Unlimited OCR 2 (3B-A0.6B) | Q3_K_M | 3.0 GB | 10.6 tok/s | Runs welltight fit |
| 42Fair quality (C) · 42 of 100: how capable the model is at Q2_K, whatever it runs on. Match score 63/100 (quality, fit, speed and memory use) sets the ranking. | MiniCPM5 2B | Q2_K | 2.2 GB | 3.3 tok/s | Slow |
| 47Fair quality (C) · 47 of 100: how capable the model is at Q4_K_M, whatever it runs on. Match score 63/100 (quality, fit, speed and memory use) sets the ranking. | Nemotron 3 Nano 4B | Q4_K_M | 3.4 GB | 1.3 tok/s | Very slowtight fit |
| 43Fair quality (C) · 43 of 100: how capable the model is at Q2_K, whatever it runs on. Match score 63/100 (quality, fit, speed and memory use) sets the ranking. | Gemma 4 E2B | Q2_K | 3.0 GB | 3.6 tok/s | Slowtight fit |


Best Image models for the TerraMaster F5-221
| Quality | Model | Quant | Memory | Speed | Runs |
|---|---|---|---|---|---|
| 72Great quality (A) · 72 of 100: how capable the model is at Q4 GGUF, whatever it runs on. Match score 61/100 (quality, fit, speed and memory use) sets the ranking. | FLUX.2 [klein] 4B | Q4 GGUF | 2.9 GB | 17.8 min | Very slowCPU offload |
| 42Fair quality (C) · 42 of 100: how capable the model is at FP16, whatever it runs on. Match score 60/100 (quality, fit, speed and memory use) sets the ranking. | Realistic Vision V5.1 | FP16 | 2.8 GB | 13.7 min | Very slow |
| 76Great quality (A) · 76 of 100: how capable the model is at Q4 GGUF, whatever it runs on. Match score 59/100 (quality, fit, speed and memory use) sets the ranking. | MOSS-Image SFT | Q4 GGUF | 3.3 GB | 4.2 h | Very slowtight fit · CPU offload |
| 40Fair quality (C) · 40 of 100: how capable the model is at FP16, whatever it runs on. Match score 59/100 (quality, fit, speed and memory use) sets the ranking. | DreamShaper 8 | FP16 | 2.8 GB | 13.7 min | Very slow |
| 35Basic quality (D) · 35 of 100: how capable the model is at FP16, whatever it runs on. Match score 57/100 (quality, fit, speed and memory use) sets the ranking. | Stable Diffusion 1.5 | FP16 | 2.8 GB | 13.7 min | Very slow |
| 30Basic quality (D) · 30 of 100: how capable the model is at FP16, whatever it runs on. Match score 57/100 (quality, fit, speed and memory use) sets the ranking. | LCM DreamShaper v7 | FP16 | 2.8 GB | 2.9 min | Very slow |


Best Video models for the TerraMaster F5-221
| Quality | Model | Quant | Memory | Speed | Runs |
|---|---|---|---|---|---|
| 35Basic quality (D) · 35 of 100: how capable the model is at FP16, whatever it runs on. Match score 44/100 (quality, fit, speed and memory use) sets the ranking. | AnimateDiff v3 (SD 1.5) | FP16 | 2.6 GB | 4.9 h | Very slowCPU offload |

Best Decision models for the TerraMaster F5-221
| Quality | Model | Quant | Memory | Speed | Runs |
|---|---|---|---|---|---|
| 86Excellent quality (A+) · 86 of 100: how capable the model is at Q8_0, whatever it runs on. Match score 79/100 (quality, fit, speed and memory use) sets the ranking. | Jina Reranker v3.5 | Q8_0 | 1.7 GB | 51.4 s | Very slow |
| 84Great quality (A) · 84 of 100: how capable the model is at Q8_0, whatever it runs on. Match score 78/100 (quality, fit, speed and memory use) sets the ranking. | Jina Reranker v3 | Q8_0 | 1.7 GB | 51.4 s | Very slow |
| 82Great quality (A) · 82 of 100: how capable the model is at Q8_0, whatever it runs on. Match score 77/100 (quality, fit, speed and memory use) sets the ranking. | mxbai-rerank-large v2 | Q8_0 | 2.6 GB | 132.0 s | Very slow |
| 80Great quality (A) · 80 of 100: how capable the model is at Q8_0, whatever it runs on. Match score 76/100 (quality, fit, speed and memory use) sets the ranking. | GLiNER2.5 Decide | Q8_0 | 1.2 GB | 22.7 s | Very slow |
| 80Great quality (A) · 80 of 100: how capable the model is at Q8_0, whatever it runs on. Match score 76/100 (quality, fit, speed and memory use) sets the ranking. | FRIDA-Decisions | Q8_0 | 1.7 GB | 38.0 s | Very slow |
| 80Great quality (A) · 80 of 100: how capable the model is at Q8_0, whatever it runs on. Match score 76/100 (quality, fit, speed and memory use) sets the ranking. | Qwen3 Reranker 0.6B | Q8_0 | 1.7 GB | 51.4 s | Very slow |
| 80Great quality (A) · 80 of 100: how capable the model is at Q8_0, whatever it runs on. Match score 76/100 (quality, fit, speed and memory use) sets the ranking. | zerank-1 small | Q8_0 | 2.9 GB | 147.4 s | Very slow |
| 78Great quality (A) · 78 of 100: how capable the model is at Q8_0, whatever it runs on. Match score 76/100 (quality, fit, speed and memory use) sets the ranking. | OpenAI Privacy Filter | Q8_0 | 2.4 GB | 2.3 s | Very slow |


Other products with the Intel Celeron J3455 / N3450 (Apollo Lake) NAS (6 GB)
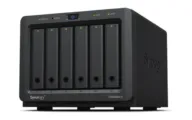 DS620slimProduct page (opens in a new tab)Discontinued
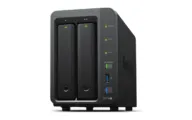 DS718+Product page (opens in a new tab)Discontinued
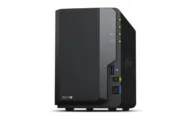 DS218+Product page (opens in a new tab)Discontinued
- F2-221Product page (opens in a new tab)Discontinued
Spec sources
Estimates come from published hardware specs and our open formulas, not from running the model on your machine. Real speed varies with runtime, drivers and settings. Numbers marked “Measured” come from a linked benchmark.