

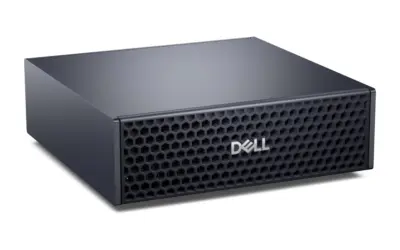
Products · Dell · Mini PC
Dell Pro Max with GB10
- Chip
- NVIDIA GB10
- Unified memory
- 64 or 128 GB
- Launch price
- $3,699
- Released
- 2025
Configurations
Pick one to see which models it runs. More memory lets larger models fit; bandwidth sets how fast they answer.
| Configuration | Memory | Usable for AI | Bandwidth | LLMs that run well | Launch price |
|---|---|---|---|---|---|
| NVIDIA GB10 | 64.0 GB | 57.6 GB | 273 GB/s | 489 of 622 | — |
| NVIDIA GB10 | 128 GB | 115 GB | 273 GB/s | 514 of 622 | $3,699 |
Specifications 64.0 GB configuration
| Maker | Dell |
|---|---|
| Type | Mini PC |
| Chip | NVIDIA GB10 (64 GB) |
| Unified memory | 64.0 GB |
| Usable for AI models | 57.6 GB |
| Memory bandwidth | 273 GB/s |
| FP16 compute | 31.0 TFLOPS |
| Notes | FCM1253 micro, 2 TB/4 TB. Launch price not confirmed; Dell US page currently $5,688 (2 TB). |
| Product page | www.dell.com (opens in a new tab) |
Best LLMs for the Dell Pro Max with GB10 64.0 GB
| Quality | Model | Quant | Memory | Speed | Runs |
|---|---|---|---|---|---|
| 93Excellent quality (A+) · 93 of 100: how capable the model is at Q8_0, whatever it runs on. Match score 97/100 (quality, fit, speed and memory use) sets the ranking. | Qwen3.6 35B-A3B | Q8_0 | 43.5 GB | 46.8 tok/s | Runs great |
| 93Excellent quality (A+) · 93 of 100: how capable the model is at Q8_0, whatever it runs on. Match score 96/100 (quality, fit, speed and memory use) sets the ranking. | MiniCPM-V 4.7 35B-A3B | Q8_0 | 42.7 GB | 46.8 tok/s | Runs great |
| 93Excellent quality (A+) · 93 of 100: how capable the model is at Q8_0, whatever it runs on. Match score 96/100 (quality, fit, speed and memory use) sets the ranking. | Qwen3.5 35B-A3B | Q8_0 | 43.5 GB | 46.8 tok/s | Runs great |
| 92Excellent quality (A+) · 92 of 100: how capable the model is at Q8_0, whatever it runs on. Match score 96/100 (quality, fit, speed and memory use) sets the ranking. | Nex N2 Mini (35B-A3B) | Q8_0 | 42.6 GB | 46.8 tok/s | Runs great |
| 91Excellent quality (A+) · 91 of 100: how capable the model is at Q8_0, whatever it runs on. Match score 95/100 (quality, fit, speed and memory use) sets the ranking. | KAT-Coder V2.5 Dev (35B-A3B) | Q8_0 | 42.1 GB | 46.8 tok/s | Runs great |
| 91Excellent quality (A+) · 91 of 100: how capable the model is at Q8_0, whatever it runs on. Match score 95/100 (quality, fit, speed and memory use) sets the ranking. | Sage-A1.5 35B-A3B | Q8_0 | 43.5 GB | 46.8 tok/s | Runs great |
| 90Excellent quality (A+) · 90 of 100: how capable the model is at Q8_0, whatever it runs on. Match score 95/100 (quality, fit, speed and memory use) sets the ranking. | Flint (40B-A2.5B) | Q8_0 | 47.6 GB | 54.2 tok/s | Runs great |
| 90Excellent quality (A+) · 90 of 100: how capable the model is at Q8_0, whatever it runs on. Match score 95/100 (quality, fit, speed and memory use) sets the ranking. | Ornith 1.5 35B-A3B | Q8_0 | 43.5 GB | 46.8 tok/s | Runs great |
| 89Excellent quality (A+) · 89 of 100: how capable the model is at Q8_0, whatever it runs on. Match score 95/100 (quality, fit, speed and memory use) sets the ranking. | Apodex 1.1 Mini (35B-A3B) | Q8_0 | 43.5 GB | 46.8 tok/s | Runs great |
| 89Excellent quality (A+) · 89 of 100: how capable the model is at Q8_0, whatever it runs on. Match score 95/100 (quality, fit, speed and memory use) sets the ranking. | Ornith 1.0 35B-A3B | Q8_0 | 43.5 GB | 46.8 tok/s | Runs great |


Best Image models for the Dell Pro Max with GB10 64.0 GB
| Quality | Model | Quant | Memory | Speed | Runs |
|---|---|---|---|---|---|
| 92Excellent quality (A+) · 92 of 100: how capable the model is at FP16, whatever it runs on. Match score 96/100 (quality, fit, speed and memory use) sets the ranking. | Krea 2 Turbo | FP16 | 37.4 GB | 9.0 s | Runs great |
| 84Great quality (A) · 84 of 100: how capable the model is at FP16, whatever it runs on. Match score 92/100 (quality, fit, speed and memory use) sets the ranking. | FLUX.2 [klein] 9B | FP16 | 37.1 GB | 3.8 s | Runs great |
| 89Excellent quality (A+) · 89 of 100: how capable the model is at FP16, whatever it runs on. Match score 89/100 (quality, fit, speed and memory use) sets the ranking. | Qwen-Image 2.1 Turbo | FP16 | 46.7 GB | 24 s | Runs well |
| 85Excellent quality (A+) · 85 of 100: how capable the model is at FP16, whatever it runs on. Match score 88/100 (quality, fit, speed and memory use) sets the ranking. | ERNIE-Image Turbo | FP16 | 26.4 GB | 6.7 s | Runs great |
| 91Excellent quality (A+) · 91 of 100: how capable the model is at FP16, whatever it runs on. Match score 88/100 (quality, fit, speed and memory use) sets the ranking. | FLUX 3 Image Klein | FP16 | 22.4 GB | 12 s | Runs great |
| 84Great quality (A) · 84 of 100: how capable the model is at FP16, whatever it runs on. Match score 86/100 (quality, fit, speed and memory use) sets the ranking. | Z-Image Turbo | FP16 | 22.7 GB | 5.2 s | Runs great |


Best Video models for the Dell Pro Max with GB10 64.0 GB
| Quality | Model | Quant | Memory | Speed | Runs |
|---|---|---|---|---|---|
| 86Excellent quality (A+) · 86 of 100: how capable the model is at FP8, whatever it runs on. Match score 93/100 (quality, fit, speed and memory use) sets the ranking. | LTX-2.5 (22B, video + audio) | FP8 | 48.3 GB | 2.8 min | Runs great |
| 68Good quality (B) · 68 of 100: how capable the model is at FP16, whatever it runs on. Match score 85/100 (quality, fit, speed and memory use) sets the ranking. | LTX-Video 13B 0.9.8 (distilled) | FP16 | 47.9 GB | 2.1 min | Runs great |
| 84Great quality (A) · 84 of 100: how capable the model is at FP8, whatever it runs on. Match score 85/100 (quality, fit, speed and memory use) sets the ranking. | LTX-2.3 | FP8 | 44.3 GB | 12.5 min | Slow |
| 80Great quality (A) · 80 of 100: how capable the model is at FP8, whatever it runs on. Match score 83/100 (quality, fit, speed and memory use) sets the ranking. | LTX-2 (19B, video + audio) | FP8 | 44.3 GB | 12.5 min | Slow |
| 85Excellent quality (A+) · 85 of 100: how capable the model is at FP16, whatever it runs on. Match score 83/100 (quality, fit, speed and memory use) sets the ranking. | Bernini-R A14B (video generation + editing) | FP16 | 46.0 GB | 25.0 min | Slow |


Best Decision models for the Dell Pro Max with GB10 64.0 GB
| Quality | Model | Quant | Memory | Speed | Runs |
|---|---|---|---|---|---|
| 90Excellent quality (A+) · 90 of 100: how capable the model is at Q8_0, whatever it runs on. Match score 94/100 (quality, fit, speed and memory use) sets the ranking. | Qwen3 Reranker 4B | Q8_0 | 9.8 GB | 120 ms | Runs great |
| 86Excellent quality (A+) · 86 of 100: how capable the model is at F16, whatever it runs on. Match score 93/100 (quality, fit, speed and memory use) sets the ranking. | Jina Reranker v3.5 | F16 | 6.6 GB | 25 ms | Runs great |
| 88Excellent quality (A+) · 88 of 100: how capable the model is at Q8_0, whatever it runs on. Match score 93/100 (quality, fit, speed and memory use) sets the ranking. | zerank-2 | Q8_0 | 9.8 GB | 120 ms | Runs great |
| 84Great quality (A) · 84 of 100: how capable the model is at Q8_0, whatever it runs on. Match score 92/100 (quality, fit, speed and memory use) sets the ranking. | Intern-Decision 4B | Q8_0 | 10.1 GB | 83 ms | Runs great |
| 84Great quality (A) · 84 of 100: how capable the model is at F16, whatever it runs on. Match score 92/100 (quality, fit, speed and memory use) sets the ranking. | Jina Reranker v3 | F16 | 6.6 GB | 25 ms | Runs great |
| 86Excellent quality (A+) · 86 of 100: how capable the model is at Q8_0, whatever it runs on. Match score 92/100 (quality, fit, speed and memory use) sets the ranking. | Shieldstral 1.0 3B | Q8_0 | 9.5 GB | 115 ms | Runs great |
| 82Great quality (A) · 82 of 100: how capable the model is at F16, whatever it runs on. Match score 91/100 (quality, fit, speed and memory use) sets the ranking. | d1 3B | F16 | 11.5 GB | 79 ms | Runs great |
| 82Great quality (A) · 82 of 100: how capable the model is at F16, whatever it runs on. Match score 91/100 (quality, fit, speed and memory use) sets the ranking. | mxbai-rerank-large v2 | F16 | 8.3 GB | 59 ms | Runs great |


Other products with the NVIDIA GB10 (64 GB)

Spec sources
Estimates come from published hardware specs and our open formulas, not from running the model on your machine. Real speed varies with runtime, drivers and settings. Numbers marked “Measured” come from a linked benchmark.